
Scaling PHP FPM based on utilization demand on Kubernetes
Ever since I've migrated to Kubernetes I've been working on a
Matomo Helm chart. Part of that Helm chart is having autoscale it on how
busy PHP FPM is, a.k.a. the percentage of busy workers.

FPM Configuration
In order to be able to scale well later on we want our FPM configuration to be predictable. So we're going to configure
it with a fixed number of always running workers. The following configuration
will have 20 workers (referred to as children by FPM) that are always running. Each worker gets restarted after
handling 1000 requests. The advantage of this is that we have know the total worker count, the idle worker count, and
the active worker count, with the added bonus that it's slightly faster than having to start a new process when we're
out of idle workers.
pm = static
pm.max_children = 20
pm.max_requests = 1000
Resources
Before we can do anything useful with the worker usage metrics we must ensure that we have both the CPU and the memory
resources for our pods configured. This is something you'd have to figure out for your own application. A good starting
point is to set CPU resources to 1 and 512Mi memory. For my own Matomo I'm at 500m CPU and 245Mi memory as it's low
traffic. Once you have container metrics from Kubernetes have a look at how much CPU and memory it's really using and
adjust to the point where the CPU won't get throttled anymore, and your container won't get OOMKilled for using too
much memory.
Note: Make sure that you tweak the resources well before you move on to the next steps, it is really important for the
stability of your service and effects autoscaling fundamentally same as the FPM configuration. The engineering team
at Omio write a great article that dives deep in how CPU throttling works in Kubernetes.
Metrics
In order to scale we need one very important bit of information: Metrics. Since FPM doesn't expose Prometheus
metrics, yet, we're going with sidecar container for that using
php-fpm_exporter. The following container definition sets up a
resource tight (enough to run it) container for metrics scraping from FPM, assuming it's on port 9666:
- name: fpm-metrics
  image: "hipages/php-fpm_exporter:1"
  imagePullPolicy: IfNotPresent
  readinessProbe:
    httpGet:
      path: /metrics
      port: fpm-metrics
    periodSeconds: 5
  livenessProbe:
    httpGet:
      path: /metrics
      port: fpm-metrics
    periodSeconds: 5
  startupProbe:
    failureThreshold: 120
    periodSeconds: 1
    httpGet:
      path: /metrics
      port: fpm-metrics
  env:
    # FastCGI address where FPM listens on, we're connecting over TCP
    - name: PHP_FPM_SCRAPE_URI
      value: tcp://127.0.0.1:9666/status
    # Address on which to expose metrics and web interface.
    - name: PHP_FPM_WEB_LISTEN_ADDRESS
      value: 6999
    # Path under which to expose metrics.
    - name: PHP_FPM_WEB_TELEMETRY_PATH
      value: /metrics
    # Enabled to calculate process numbers via php-fpm_exporter since PHP-FPM sporadically reports wrong active/idle/total process numbers.
    - name: PHP_FPM_FIX_PROCESS_COUNT
      value: "true"
    # Only log messages with the given severity or above. Valid levels: [debug, info, warn, error, fatal] (default "error")
    - name: PHP_FPM_LOG_LEVEL
      value: info
  resources:
    limits:
      cpu: 40m
      memory: 32Mi
    requests:
      cpu: 40m
      memory: 32Mi
Next up make sure these metrics are scraped by Prometheus so we can use them in the next step.
Prometheus Adapter
While Prometheus is pretty much the facto default in metrics on Kubernetes, Kubernetes doesn't come with scaling
support based on it build in. In order to be able to scale based on Prometheus metrics we're going to need an
adapter, prometheus-adapter specifically. It even comes
with a Helm chart!
The following is a snippet is from my values.yaml for the prometheus-adapter Helm chart. It defines a metric
named phpfpm_process_utilization and makes it available as a custom metric to the Horizontal Pod Autoscaler:
rules:
  default: false
  custom:
    - seriesQuery: 'phpfpm_total_processes_gauge{namespace!="",pod_name!=""}'
      resources:
        overrides:
          namespace:
            resource: "namespace"
          pod_name:
            resource: "pod"
      name:
        matches: "phpfpm_total_processes_gauge"
        as: "phpfpm_process_utilization"
      metricsQuery: 'max((100 / phpfpm_total_processes_gauge) * phpfpm_active_processes_gauge) by (<<.GroupBy>>)'
Since I'm using Victoria Metrics instead of Prometheus on my personal cluster,
because it's less resource intensive, the metrics names have the _gauge suffix.
The metricsQuery at the bottom will calculate the maximum percentage active workers among all the matched pods and
exposes that percentage as a custom metric.
For more information on the details and how a custom metric works have a look configuration documentation.
Validating the custom metrics
Before we can start on the Horizontal Pod Autoscaler we want to make sure our metrics are picked up and available as expected. We can achieve that by making a raw request for those metrics using kubectl. The call is as follows:
kubectl get --raw "/apis/custom.metrics.k8s.io/v1beta1/namespaces/REPLACE_THIS_NAMESPACE/pods/*/phpfpm_process_utilization"
Note: Be sure to replace REPLACE_THIS_NAMESPACE with the namespace you deployed your PHP FPM deployment to.
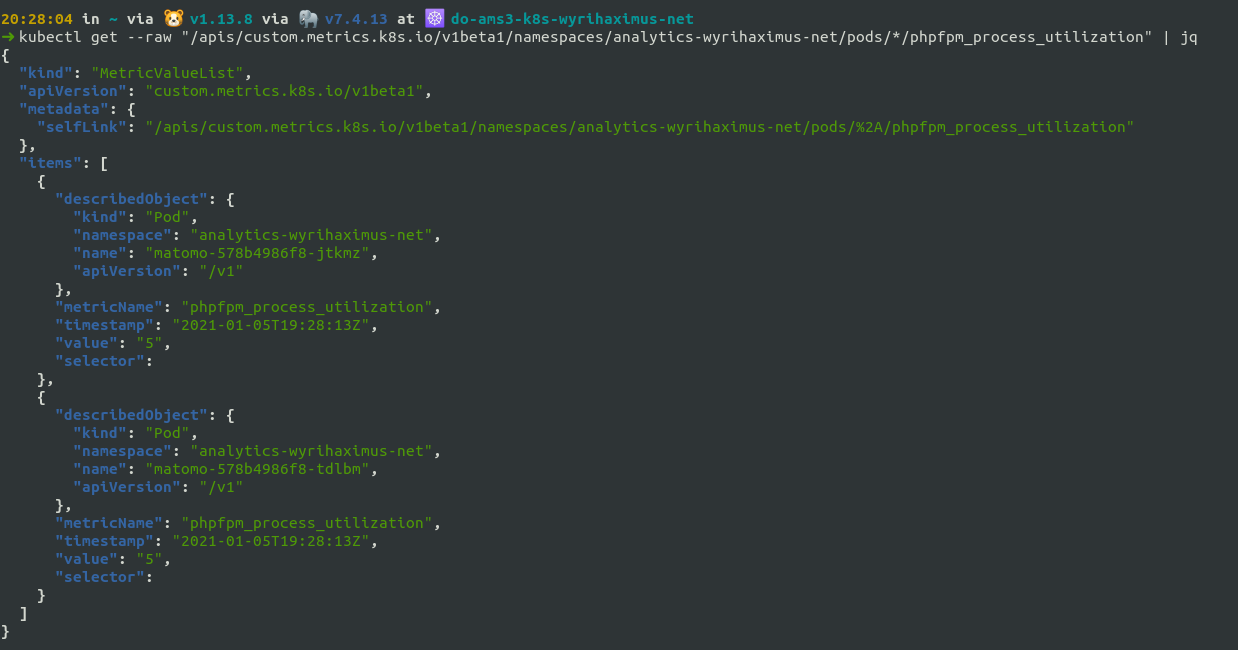
The result should like something like the above. If you don't get anything back keep in mind it might take up to a minute depending on how often you refresh the metrics.
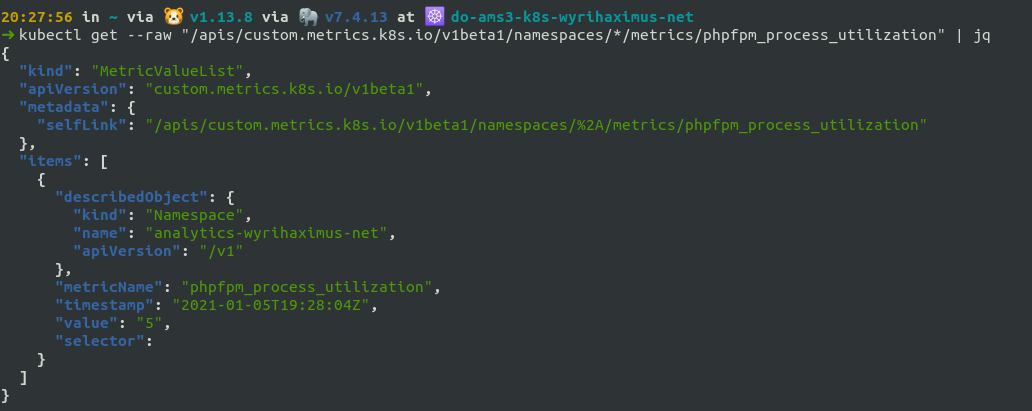
Alternatively you can get the custom metric across namespaces with:
kubectl get --raw "/apis/custom.metrics.k8s.io/v1beta1/namespaces/*/metrics/phpfpm_process_utilization"
Horizontal Pod Autoscaler
Putting this all together is the Horizontal Pod Autoscaler. Out of the box it can scale on CPU and memory usage metrics, but with custom metrics you can feed it anything that fits your use case. Consider the following Horizontal Pod Autoscaler:
apiVersion: autoscaling/v2beta2
kind: HorizontalPodAutoscaler
metadata:
  name: matomo
spec:
  scaleTargetRef:
    apiVersion: apps/v1
    kind: Deployment
    name: matomo
  minReplicas: 2
  maxReplicas: 1024
  behavior:
    scaleDown:
      policies:
        - type: Pods
          value: 1
          periodSeconds: 60
  metrics:
    - type: Resource
      resource:
        name: cpu
        target:
          type: Utilization
          averageUtilization: 50
It does a few things:
* It targets a deployment with the name matomo
* It enforces a minimum number of two replicas based on defined metrics
* It scales up to a maximum of 1024 pods (probably way too much for most use cases so this is more of a "infinite scaling" number)
* It scales up using default behavior
* It scales down after one minute instead of five, but limits it to one pod per minute
* When CPU utilization averages at 50% across all pods it will scale up, and keeps scaling up until it drops under 50% again
Under the metrics section of the spec we're going to add the following:
- type: Pods
  pods:
    metric:
      name: phpfpm_process_utilization
    target:
      type: AverageValue
      averageValue: "50"
This uses the phpfpm_process_utilization we defined earlier and scales up when it hits 50% average utilization. Now
the reason we're scaling at 50% is, so we have enough margin to handle sudden traffic surge. When such a surge comes in
the number of active workers will rise about 50 percent, and the Horizontal Pod Autoscaler will scale the replicaset
up and more pods will join the pool with more available workers.
Conclusion
Before diving into this I was looking up to it and was expecting it to be more complicated then it turned out to be.
Spent 3 - 4 hours from start to finish getting this up and running, including two hours fighting with getting the
PromQL query to work in prometheus-adapter. The
result is totally worth it and I now have a scaling Matomo deployment that keeps up with whatever amount of traffic
it gets. (The MySQL server might be the next bottleneck.)